Vegetation Mapping Using Multispectral UAV Images
An Invaluable Source of Data for Green Area Management
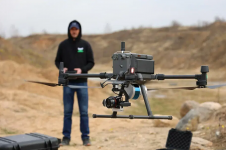
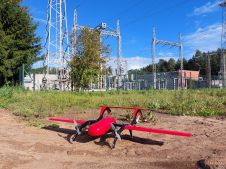
DJI recently introduced the P4 multispectral, a high-precision unmanned aerial vehicle (UAV or ‘drone’) which exploits the integration of multispectral cameras to facilitate agricultural and environmental monitoring applications. Therefore, imagery data collection for vegetation mapping is now simpler and more efficient than ever before.
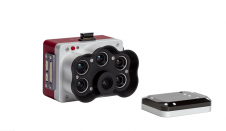
In the DJI P4 multispectral, images are collected by an RGB camera and a multispectral camera array with five global shutter cameras covering blue, green, red, red-edge, and near-infrared bands at a resolution of 1,600 x 1,300 pixels (Figure 1). Real-time, centimetre-accurate positioning data on images captured by all six cameras within DJI’s built-in system is used to align the flight controller, RGB/multispectral cameras and RTK module. This fixes the positioning data to the centre of the CMOS and ensures that each image uses the most accurate metadata. All cameras benefit from the calibration process whereby radial and tangential lens distortions are measured and saved into each image’s metadata to ease post-processing of the images.
More importantly, an integrated spectral sunlight sensor on top of the UAV captures solar irradiance to maximize the accuracy and consistency of data collection at different times of the day. This enables the most accurate NDVI results to be achieved.

Study area and data collection
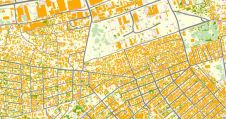
Babol Noshirvani University of Technology (BNUT), which is the leading university in Iran according to the Times Higher Education World University Rankings, is located in north of the country. The campus comprises 11 hectares of several buildings and a green area which is mainly covered by orange trees (Figure 2).
The dataset was collected on 24 October 2020. The flight was planned in the DJI GS Pro iPad app at an altitude of 70 metres with 65% forward and side overlaps. The image collection was done at noon to minimize the shadows, and it took approximately ten minutes to cover the campus with 522 geotagged vertical RGB and multispectral images.

Data processing
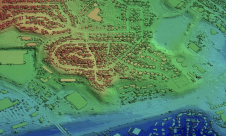
The photogrammetric processing of the UAV images was carried out usingAgisoftMetashape软件。处理工作流,包括uding image alignment to produce sparse point clouds, build dense cloud, build mesh, build texture, build the digital elevation model (DEM) and build the orthomosaic – was performed and lastly, to generate a 3D map of the study area, the multispectral point clouds and orthomosaic were exported in (.las) and (.tiff) formats, respectively. The 3D point cloud with a density of 900 points/m² and orthomosaic with a ground sampling distance (GSD) of 3 centimetres were generated from the point clouds and the images (Figure 3).

Results
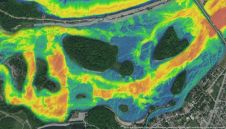
The multispectral orthomosaic derived from the photogrammetric processing of the UAV images was used to calculate vegetation indices as indicated in Table 1. The well-known multispectral and visible-band vegetation indices such as NDVI, NDRE, NGRDI, VIDVI, CIVE, ExG, ExR and VEG were utilized. The corresponding vegetation index maps for the study area are shown in Figure 4.
Although trees and lawns are highlighted by all vegetation indices, vegetation areas are more distinguishable by NDVI. Additionally, buildings and non-vegetated areas are clearly highlighted by all indices. The NDI and VEG indices provided similar results and outperformed other visible-band indices. The CIVE, VDVI, ExG and ExR indices are sensitive to shadows. As a result, shadow areas are highlighted as vegetation.

Conclusion
多光谱无人机图像可用于许多达成ications such as urban tree mapping, horticulture, precision agriculture and more. In addition to opening up a new era of applications, the RGB-derived vegetation indices can be calibrated and validated more accurately using multispectral UAV images. As a result, UAV-based RGB images will be an invaluable source of data for green area management in urban and rural areas.

Future reading
McKinnon, Tom, and Paul Hoff. Comparing RGB-based vegetation indices with NDVI for drone-based agricultural sensing.Agribotix. Com21.17 (2017): pp. 1-8.
Yeom, Junho, et al. Comparison of vegetation indices derived from UAV data for differentiation of tillage effects in agriculture.Remote Sensing11.13 (2019): p. 1,548.
Starý, K., et al. Comparing RGB-based vegetation indices from UAV imageries to estimate hops canopy area.Agronomy Research18.4 (2020): pp. 2,592-2,601.
Acknowledgements
The author would like to thank Roodkhiz Water and Environment Company for collecting the UAV images.
Make your inbox more interesting.Add some geo.
Receive a weekly summary of the biggest news, along with the best stories, case studies, and key market insights.
Sign up for free

