Predicting the Future by Mapping the Past
Pushing the Limits on Lidar Change Detection at Regional Scales
Lidar change detection (LCD) is one of the most capable techniques for mapping changing terrain through time. It can be applied in billion-dollar decisions to design, build and operate tunnels, bridges, highways, railways, pipelines or subdivisions, which require engineers to evaluate how the earth will behave for decades to come. Predicting morphological change involves a deep understanding and appreciation of geology, geological processes, climate change and knowledge as to what physical changes have happened in the past or may occur in the future. This article presents how utilizing a graphics processing unit (GPU) and digital delivery of results can improve the LCD process by a factor of a thousand, opening up previously unthinkable applications.
LCD is the numerical process of comparing multiple Lidar datasets with overlapping coverage from different points in time. Airborne Lidar scanning (ALS) LCD is used by engineers and geoprofessionals to identify and track changing ground conditions commonly associated with geohazards such as landslides, flooding, bank erosion, debris slides, subsidence and rockfalls/avalanches, as well as assets such as embankments, highway pavement, bridges, open pits and dams. Conducting LCD analysis is typically completed using one of three general approaches:
- 数字高程模型(DEM)差分。DEM differencing calculates the vertical change between two DEMs at each raster cell, typically at a resolution of 1m. This LCD method is the most efficient and simplest to run, facilitating its use on geographically expansive datasets. However, the results of this approach are generally an order of magnitude less accurate than a fully optimized 3D solution (see point 3 below).
- 3D point-based normal or shortest distance-based differencing (M3C2).基于3 d点的液晶是计算差异en two bare earth point cloud datasets along vectors representing the local normal of each individual point in the dataset, or the shortest distance between multiple datasets. This method is computationally expensive and requires ALS datasets to be subdivided into smaller zones (typically less than 30 million points per dataset) for processing. This method produces enhanced results over DEM differencing (see point 1 above) as the results represent a true 3D change based on the full resolution of the point-cloud data.
- ICP预先对准3D点的正常或最短距离。迭代最近点(ICP) pre-alignment 3D change measurement is a modification of point 2 above that utilizes advanced 3D error reduction algorithms to reduce the spatial noise between the ALS datasets prior to conducting the LCD. This spatial noise often presents itself as a systematic difference between the two datasets due to ground control and georeferencing at the time of data collection. The ICP process adds considerable computational expense and the use of advanced algorithms to the processing chain to spatially adjust the data while not introducing further errors. This is the most accurate approach to conducting LCD.

In the case of applied earth science applications, a 3D point-based approach with ICP pre-alignment captures the mechanics of the changing ground in the most accurate way, given that purely vertical changes resulting from the DEM differencing approach rarely represent the true mechanism of ground movement, and errors from the georeferencing misalignments are significantly reduced.
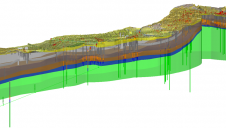
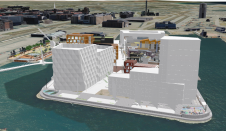
图1和图2中的示例突出了一个情况,在没有ICP的情况下,计算基于3D点云的变更检测(图1)将不允许检测活跃的滑坡,而在使用更改检测结果中立即明显的是使用基于ICP 3D点的LCD(图2)。

US Highway 101
为了证明高级LCD处理的各种LCD方法和功率,下面介绍了由加利福尼亚州北加利福尼亚州北加州公路101号的加利福尼亚运输部(CALTRANS)购买的ALS数据,该数据在下面介绍了一个名为Last Change等级的区域。在这个位置,高速公路穿越陡峭的斜坡和海洋虚张声势,它们正在积极侵蚀并参与滑坡工艺。
LCD结果比较了2016年和2020年收集的ALS数据。在图3中提供了LCD结果,通常以颜色包含的数据集覆盖在裸地地形模型上。大于检测极限(LOD)的模型差异通常是从结果中滤除的。LOD是根据95%置信区间计算的,并取决于两个LiDAR数据集之间的空间比对质量。蓝色代表负面变化的区域(物质损失或沉降),红色代表积极变化的区域(材料积累,凸起或促进)。
Switching from the DEM-based approach to a 3D point cloud-based approach at Last Chance Grade resulted in a reduction of the limit of detection by 3 to 4cm, and using the ICP combined with 3D point cloud-based approach resulted in a further reduction of the limit of detection by 4 to 8cm. This is an overall reduction in the LoD of 40%. The impact of the error reduction on infrastructure monitoring is significant, and the ability to detect these small changes is extremely valuable. This allows owners and engineers to act sooner and be more proactive in managing assets to reduce overall lifecycle costs.

LCD的愿景和问题
图1、2和3说明了利用ICP预先对齐的LCD的基于点的变更检测方法的优势。随着ALS数据的收集频率更高,密度比以往任何时候都更高,因此高级LCD的用例正在增加。为工程师,地理专业人士和资产所有者提供评估和交流3D空间变化的方法的能力是了解过去,预测未来行为并管理相关风险的强大工具。LCD应用程序涵盖了多个行业和应用,例如监视高速公路,铁路和管道网络,水库斜坡和海岸线以及不断变化的海岸线。然而,直到最近,在特定项目站点以外的尺度上应用高级数值方法(以上是上述方法3)的能力已极为局限于数据执行所需的适当计算资源,主题专业知识可以进行分析和数字平台用于可视化和审问结果。
为了将3D ICP LCD从单个站点扩展到区域网络,进行了三个研发项目:
- Custom-built 3D ICP LCD algorithms written using native GPU compute shaders
- Collaborative multi-user 3D environment for analysis and visualization of cloud-hosted LCD results, ortho images and terrain data
- 与地理空间资产管理软件集成,以与所有其他地理空间信息一起存储,访问和询问LCD数据。
Moving to the GPU and the world of compute shaders
在过去的20年中,GPU已从固定功能系统发展为3D渲染,转变为通用计算单元。只要这些操作是独立的,现代GPU可以并行执行数千个计算。这与CPU形成鲜明对比,CPU只能并行执行数十个操作,但可以很好地处理通用代码和条件逻辑。结果,在可以并行执行计算的情况下,GPU提供了巨大的速度增长。例如,深度学习和3D栅格化在GPU上大大加速,因为它们主要涉及在大量数据缓冲区中对每个元素进行独立的计算。
With point-cloud change detection, it is more difficult to realize these speed gains since a point-cloud change algorithm consists of two types of operation:
- Calculations, such as:
- solving for an alignment transformation
- calculating normals
- computing change values.
- Spatial queries, such as determining which points:
- are likely correspondences between two clouds
- represent the local surface around a point
- should be considered during change detection around a point.
Often, GPU implementations of systems are performed by porting existing code using frameworks like nVidia CUDA. Unfortunately, with point cloud processing, this approach results in a GPU implementation that is entirely bound by query performance since data structures commonly used for spatial queries access memory randomly and have lots of conditional logic. In fact, the result can be slower on a GPU than the same code on a CPU!
The suggested implementation performs all GPU calculations using compute shaders – the lowest level of code natively exposed by a GPU, which provides direct control over execution and parallelism which is used to achieve high performance. The authors use a chain of compute shaders for normal calculation, ICP and the change detection itself.

The authors also perform all spatial queries on the GPU, using compute shaders and linear data structures optimized for GPU hardware. Their query algorithms favour speed and returning conservative results over returning a minimal set of points. Additional points returned by the queries during calculation are then rejected. This is still faster overall, because the GPU performs calculations on redundant points faster than it can execute a more precise query.
These compute shaders are driven by a parallelized CPU framework which marshals data to and from the GPU, handles disk access and performs decompression for Lidar formats such as LAZ. The result is a system that is able to process multi-billion-point datasets in orders of magnitude faster than the fastest CPU implementations.
可视化和协作
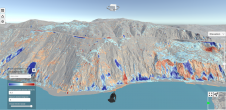
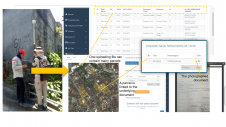
ALS data are 3D by nature, and ICP 3D point-based LCD results are best analysed in a 3D environment. BGC developed a multi-user collaborative 3D environment that allows users to ‘fly’ around the Lidar data with LCD results or walk across the terrain. The 3D environment, built on Unity-based technology, facilitates the integration of high-resolution ortho imagery, vector data and dynamic controls over the LCD results. A screenshot from a video of three separate users interacting in the collaborative space is presented in Figure 4.
Conclusion
The ability to conduct ICP 3D point-based LCD at a regional scale utilizing GPU processing, delivering results in an interactive, collaborate 3D environment, at speeds upwards of three orders of magnitude faster than CPU-based processing, is revolutionizing the usability of ALS data. In the past year, BGC has processed over 40,000 linear kilometres of LCD data, serving up tens of billions of LCD points in digital platforms to clients, globally. Being able to extract additional value from ALS data to better understand the morphological changes and behaviour of assets over time greatly enhances an engineer’s ability to make informed decisions and design resilient infrastructure.
Acknowledgements
The authors would like to thank Jaime Matteoli and Eric Wilson from CalTrans for agreeing to the use of ALS data collected along US Highway 101 and showcase the LCD results which are currently being used by the expert review panel to assist in the redesign of the highways. The authors appreciate the help of Dr Scott Anderson, Alex Graham, Matt Williams, Cole Christiansen and Luke Weidner at BGC for support in processing and interpreting the LCD results. The methods discussed in this article are patent-pending: Application #17/371,337.
Make your inbox more interesting.添加一些地理。
Keep abreast of news, developments and technological advancement in the geomatics industry.
Sign up for free


