冰桥行动
有史以来对地球极地地区的空降调查
Icebridge行动于11月底完成了2014年南极野外运动,即连续第六次。该运动旨在重新接收南极冰盖的一部分,这似乎是不可逆转的下降。从2014年10月16日起,NASA的DC-8机载实验室收集了大量数据,以便您深入了解气候变化,从而收集了大量数据。第一批冰桥航班于2009年春季在格陵兰岛和2009年秋季在南极洲进行。什么是使用哪些传感器的Icebridge操作,数据可以使用什么以及谁可以使用数据?作者提供了概述。
冰川,冰盖和雪覆盖的程度和厚度的长期变化是温度变化的指标,因此是气候变化。雪反映了传入太阳能的80-90%,而土壤,植被或岩石吸收了80-90%。吸收导致地球表面变暖,导致更多的积雪融化 - 典型的反馈回路。研究水经常在固体和液态之间交替的地方提供了深入了解冰和雪的程度和厚度的变化,从而在温度变化中变化。当冰盖和冰川涌入海中时,水位上升。但是,它们随后的熔化不会影响海平面。冰川占地10%,占世界淡水的75%,当冰川通过基岩耕作时改变了景观的形态。对这些现象及其随着时间的变化的连续研究需要在多年内收集数据深度,冰表面高程,冰的厚度以及冰下岩石的形状和成分。
从ICESAT到Icebridge
To collect such data in the Arctic and Antarctic regions NASA launched the Ice, Cloud and Land Elevation Satellite (ICESat) in 2003. It stopped collecting data by the end of 2009, and ICESat-2 is scheduled for launch in 2017. The time gap in data collection between ICESat and ICESat-2 will be bridged by airborne surveys: IceBridge. Flights with the DC-8 laboratory (Figure 1) began in October 2009, later joined by a P-3 Orion, a King Air B-200, in 2010, the Gulfstream V in 2011 and the Guardian Falcon in 2012. The campaigns are carried out when the ice surface is stable. For the Arctic region this is from March to May and for the Antarctic region from October to November (Figure 2). The daily flights each last 8 to 12 hours in which two to three terabytes of data are captured. Compared to a satellite, an aircraft can observe an area of far less extent (Figure 3) and can only collect data for a few weeks. Conversely, the benefit of using aircraft is that they can carry a suite of dedicated sensors.
传感器
The suite of sensors installed on the DC-8 laboratory and other aircraft during campaigns includes:
- Digital mapping system (DMS)
- Airborne topographic mapper (ATM)
- 陆地,植被和冰传感器(LVIS)
- 重量表
- Magnetometer
- Four radar sensors.
The four radar sensors will be treated in the next section. The DMS is a nadir-looking camera recording digital images which are stitched into mosaics and used for detecting openings in sea ice and to create detailed maps. The ATM is a scanning Lidar that measures the surface elevation. Changes in elevation of the ice surface over the years and thus volume changes can be determined from a time series. The LVIS is an additional Lidar sensor optimised for operation at high altitudes, thus enabling the survey of large areas. The gravimeter senses the density of the materials under the ice surface. Water has less density than rock and thus has a lower gravitational pull, enabling rock to be distinguished from water and the shape of water cavities under floating ice shelves to be determined. Accelerometers measure the force of gravity while gyroscopes keep the pose of the sensor stable. GNSS measurements enable removal of the accelerations caused by the motion of the aircraft. Density combined with magnetometer data gives indications about the type of bedrock material. Shape and composition of bedrock helps to predict how moving ice interacts with bedrock and how warm sea water might flow beneath the ice.
Radar
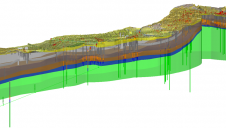
雷达允许从高海拔地区进行地下映射。Icebridge使用一个包装中集成的四个雷达传感器:(1)KU频段雷达高度计;(2)雪雷达;(3)积累雷达;(4)多通道相干雷达深度音响器(MCORDS)。传感器在电磁(EM)光谱的微波部分中工作。高频可以看到更多细节,但是穿透深度有限,而低频可以穿透几公里进入雪和冰。四个雷达的频带不同。合并它们可以检查整个雪/冰盖,从表面到基岩或海面。KU波段雷达是一个宽带高度计,在13-17GHz(波长〜2cm)的频率范围内运行,该频率范围与欧洲航天局(ESA)操作的CryoSat-2上的主要传感器相似。 The ku-band penetrates through snow and reflects off the surfaces of ice sheets and the sea. Combining this with ATM data enables the thickness of snow over sea ice to be determined. The snow radar uses the frequency range from 2-8GHz (wavelength range: 4-15cm) to map the characteristics of snow on top of ice sheets with high vertical resolution, thus allowing detection of the snow and ice surfaces and the layers in between. Its data is used to measure recent snow accumulation rates and to calculate sea-ice thickness. The frequencies of the accumulation radar range from 600-900MHz (wavelength range: 33-50cm) which may penetrate snow and ice to a depth of 100m. It shows the layers with strong and continuous reflection, thus providing insight into snow accumulation rates in the past or over longer time spans. Figure 4 shows an example of a profile generated from such radar data. The data from the accumulation radar, snow radar and ku-band radar combined enable a study of the top 100 metres, but it is not possible to build a decent ice-sheet model without good elevation data representing the bed topography. For this purpose a fourth radar has been developed: the MCoRDS, which employs many frequencies to image internal ice layering and bedrock. MCoRDS data enables improvements to computer models aimed at forecasting how ice sheets will respond to climate change.
Jacobshavn
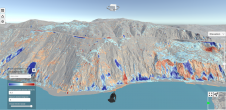
上面讨论的传感器,使snow and ice in virtual landscape models created by a computer, thus uncovering bedrock. Removing ice and snow from the land area of Greenland revealed a canyon, the longest on Earth, under the ice sheet: the Jacobshavn bed (Figure 5). Extending over 750km and with a depth of 800m and a width of 10km, the ravine matches the Grand Canyon in scale. Its discovery in August 2013 will bring better insight into how water, snow and ice move over the island. It may explain why Greenland is not filled with buried lakes, which one would expect given the bowl-shaped basin in the interior caused by the weight of the ice sheet. Water melting under the interior ice sheet seems to drain into the sea through the northern part of the canyon instead of pooling in the middle. The distinctive V shape and the flat bottom suggests that the canyon was carved by water, rather than ice, but that still does not sufficiently explain the absence of buried lakes. Maybe other canyons, as yet undiscovered, also contribute to water draining into the sea.
Open Data
The masses of data have to be processed within six months to enable timely publication on the NSIDC website. The first of the many processing steps is archiving and quality control. Next, four data categories are produced from raw data for over 60 data products. These end products result from processing data from single sensors, combining data from several sensors or from applying computer models. The ATM data, for example, is available in a raw format as distance between the aircraft and the ice sheet. Such raw range data enables users themselves to calculate ice surface elevation, ice slope and roughness, and elevation changes over time. The data can be accessed at the NSIDC website through an interactive map from which individual flight lines and datasets can be selected for downloading. The products stick to the standards of NASA’s 2006Earth Science Reference Handbook, which eases understanding and use. Its free availability allows anyone to explore the data. Scientists around the world are building maps of the bedrocks of Greenland and Antarctica, and improving seasonal forecasts of Arctic sea-ice coverage and glacial melt rates.
Concluding Remarks
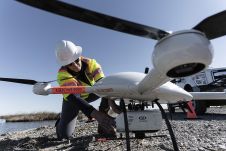
无人空中系统(UASS)可能会创建基岩的更详细地图。分辨率越好,越好 - 由于UASS可以遵循密集的飞行线路,因此非常适合它们。Icebridge即将举行的北极运动计划于2015年3月开始。
致谢
Thanks are due to George Hale, Science Outreach Coordinator of Operation IceBridge, NASA Goddard Space Flight Center, for providing information and commenting on the final draft.
THE AUTHOR
Mathias Lemmensgained a PhD degree from Delft University of Technology, The Netherlands, where he presently lectures on geodata acquisition technoogies and geodata quality. He was editor-in-chief of188金宝搏特邀for ten years and now contributes as senior editor.
Make your inbox more interesting.Add some geo.
Keep abreast of news, developments and technological advancement in the geomatics industry.
Sign up for free


