Medway Modelling or Fitting Kent on to Two Church Hall Tables
这篇文章最初发表在地理学世界。
3D modelling has become second nature to surveyors but creating a real physical model from digital data was new to Richard Groom and his colleagues at the Environment Agency’s Geomatics group. So what do you need to do to create a model big enough to fit on two church hall tables?
Nowadays the task of the surveyor is normally to produce virtual models of the Earth’s terrain and the features on its surface. But a few months ago the Geomatics team in the Environment Agency were asked to procure a physical model covering Kent, South London and East Sussex. The new model was needed to aid visualisation of the topography of the area and assist at local meetings in explaining flood management strategy.
The model was to replace a wooden model which was starting to show its age. This earlier model had been made by cutting layers of wood along successive contours and gluing them together. As a result, slopes appeared jagged rather than smooth and the effect was not pleasing to the eye.
3D Printing
We thought that 3D printing could be the answer and contacted a company in London, Lee 3D, to work up our ideas. The bread and butter of George Lee’s business is 3D models of buildings and urban landscape for architects, which help clients and stakeholders to visualise developments, so he was keen to use 3D printing for our unusual application. His full colour 3D printer could be used to produce a physical 3D model from the digital terrain model (DTM) with an image printed into the surface.
The project brief was to produce a model that could fit ‘on a pair of church hall tables’. We looked at two options: a model at 1:100,000 or at 1:75,000 and determined that 1:75,000 would fit the requirement. We decided to use a grid DTM derived from LiDAR with 20m cell size, which is equivalent to 0.3mm at printing scale. To decide what vertical exaggeration to use, we made oblique digital 3D views of the DTM with various options and decided that five times vertical exaggeration provided enough topography to show the river catchments clearly, without making south east England look alpine. You can not only see the topography of the Downs but also fine topographic detail such as quarries that pockmark the landscape.
表面图像
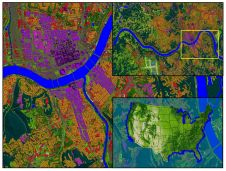
客户希望在模型上打印的基本映像,类似于用于木质模型的层着色。但是您可以打印任何图像,因此我们还考虑了几种其他选项,包括在模型地形上覆盖正交检查或小规模映射。最后,我们选择了从绿色的层遮荫,用于较低的躺在棕色的棕色上的下落。这种增强的第三尺寸的可视化。我们从环境署的主要河流地图和洪水储存区域的界限带走了河流。为此,我们为内部区域添加了基本的道路网络和阴影,然后将主要城镇和河流命名。
数据准备
Preparing the data for printing was not as straightforward as one might imagine. The solution finally chosen was for Geomatics to supply DTMs and images for each model tile. Each tile was 0.3032m × 0.2499m, equivalent to 22740m × 18740m on the ground. We calculated the coordinates of the corners of each of the 36 models and prepared the 20m resolution grid DTM data with grid data along the boundaries of each tile and images covering the same areas as JPG files. George then used his software to create a TIN (triangular irregular network) from the grid DTM and then the contour data which was needed by the printer.
打印模型
目前,客户决定仅为他的立即命令造型,从我们计划的布局中覆盖了六个瓷砖。虽然这可能似乎是一个令人失望的,但减少了模型的大小,这意味着我们不再需要考虑如何将瓷砖固定到基板上,就像我们最初计划的那样。我们可以专注于生产模型瓷砖,因为六种模型可以简单地放在教堂厅桌上。
其中一个子模型被印在试验中,然后在以下几天内打印剩下的五天。该模型正在用于一轮公开会议,之后将采取决定是否延长覆盖范围,包括整个肯特和南伦敦地区。
This article was published in Geomatics World November/December 2016


